Chart of accounts and transaction history
Two read-only screens for digging into the numbers behind your reports.
Chart of accounts
Section titled “Chart of accounts”Financial Reporting > Chart of Accounts lists every account your organization posts to, grouped under Asset, Liability, Equity, Income, Cost of Services, Expense, and Trust. Each row shows a status (Posting, Parent, or Inactive), how many transactions have hit it, and its net amount for whatever date range and basis (Accrual/Cash) you pick.
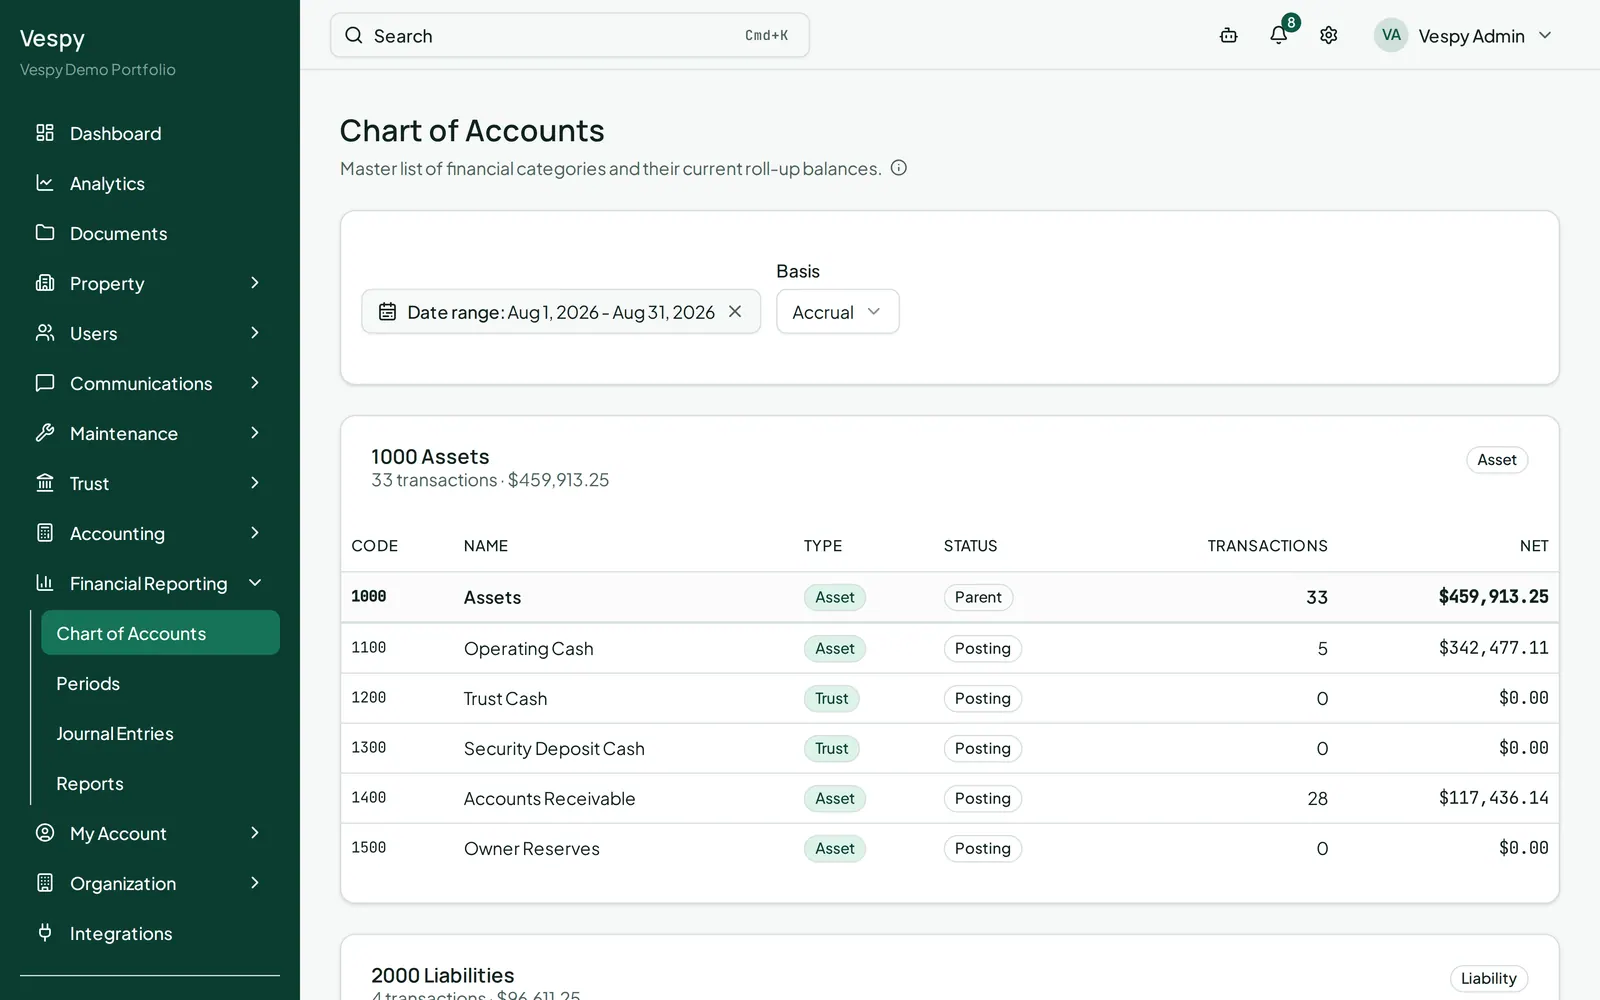
Click any account to jump straight into the General Ledger report, filtered to that account.
Transactions
Section titled “Transactions”Accounting > Transactions is the unified feed of everything posted — every charge, payment, expense, and journal entry, all in one place. Filter by Accrual/Cash basis, Book type (Operating/Trust/Security Deposit), Category, Property, and date; click More filters for Unit, Owner, Entry type, and Reference type. Active filters show as removable chips.
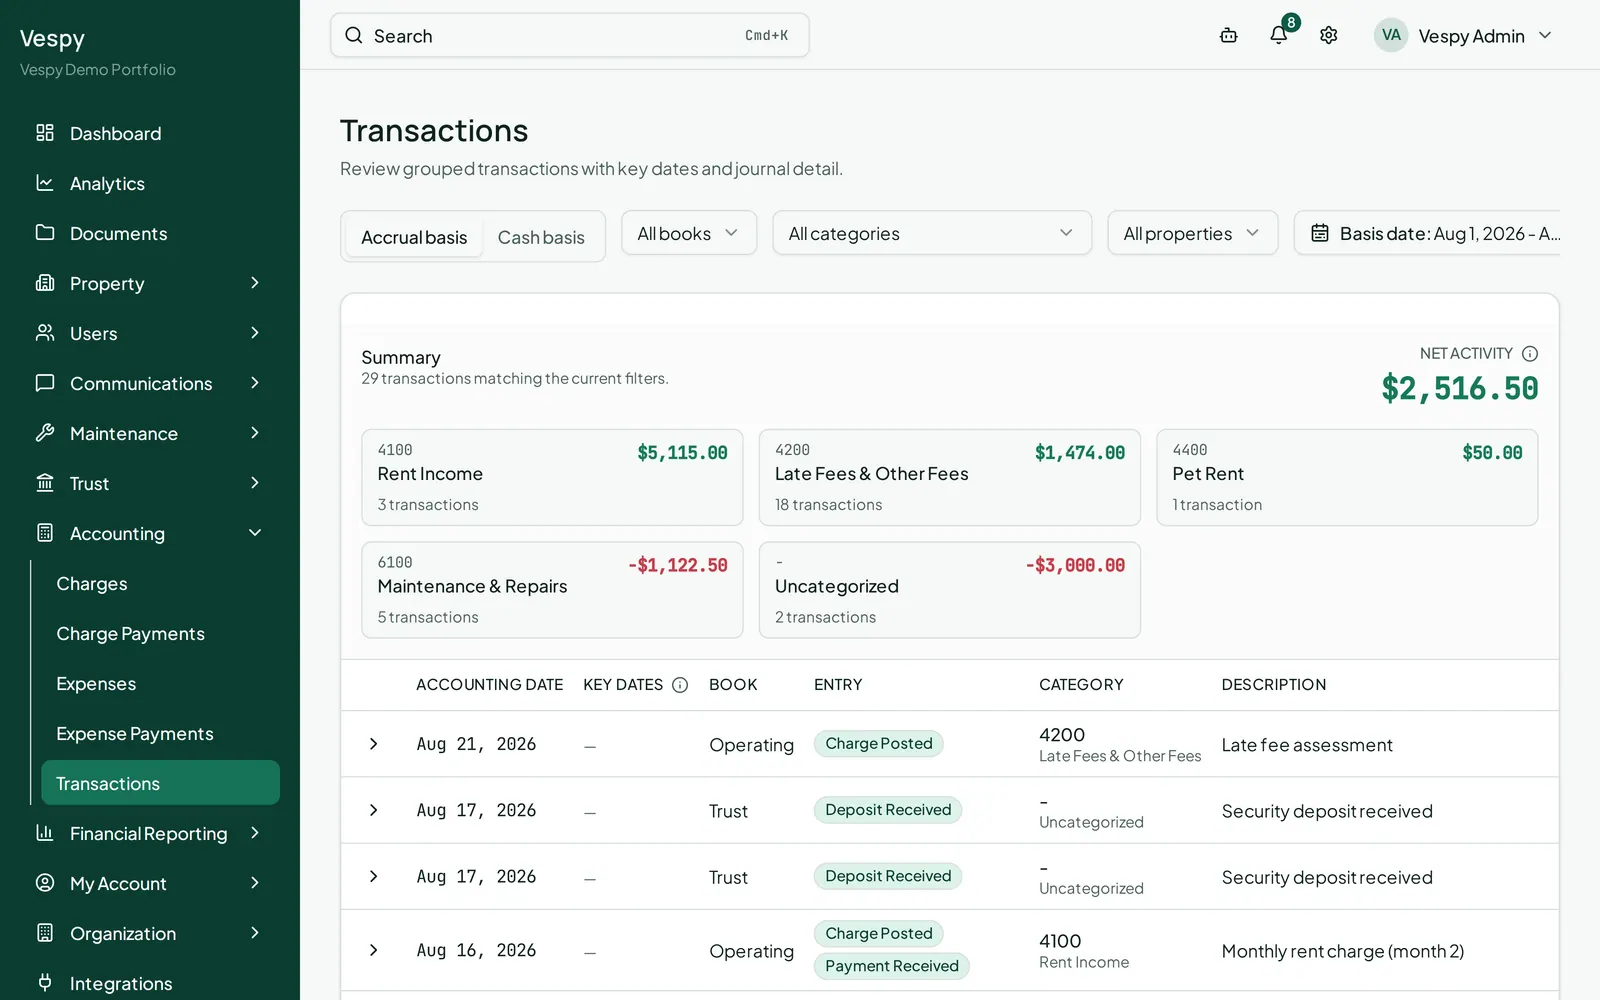
Click the expand arrow on any row to see the full, balanced entry behind it — the accounts, debits, and credits that make it up — with links from each account straight into the General Ledger. Export CSV downloads whatever you currently have filtered.
Afterwards
Section titled “Afterwards”- Running and exporting financial reports — the General Ledger and other statements these two screens link into.
- Closing the books each month — where this same activity gets locked down for a period.