Running and exporting financial reports
Go to Financial Reporting > Reports to see nine report types, each a card that opens its own page:
| Report | What it shows |
|---|---|
| Rent Roll | Occupancy, tenant, rent, deposit, and balance by unit |
| Profit & Loss | Income and expenses, down to net operating income |
| Balance Sheet | Assets, liabilities, equity, and trust balances as of a date |
| Cash Flow | Cash activity: operating, investing, financing |
| General Ledger | Every account’s opening, activity, and closing balance |
| Delinquency | Overdue tenant charges, grouped by how overdue |
| Security Deposit Ledger | Deposit balances by lease and tenant |
| Lease Expirations | Active leases grouped by how soon they expire |
| Maintenance Costs | Work order and repair costs by property, vendor, or category |
Organizations with commercial features on also get a Commercial section with seven more reports, from an area-based rent roll to CAM reconciliation. See Commercial reports.
1. Scope the report
Section titled “1. Scope the report”Most reports let you filter by Owner, Property, and Unit (Unit only unlocks once you’ve picked a Property). Maintenance Costs swaps these for Property, Unit, Tenant, Vendor, and Category instead.
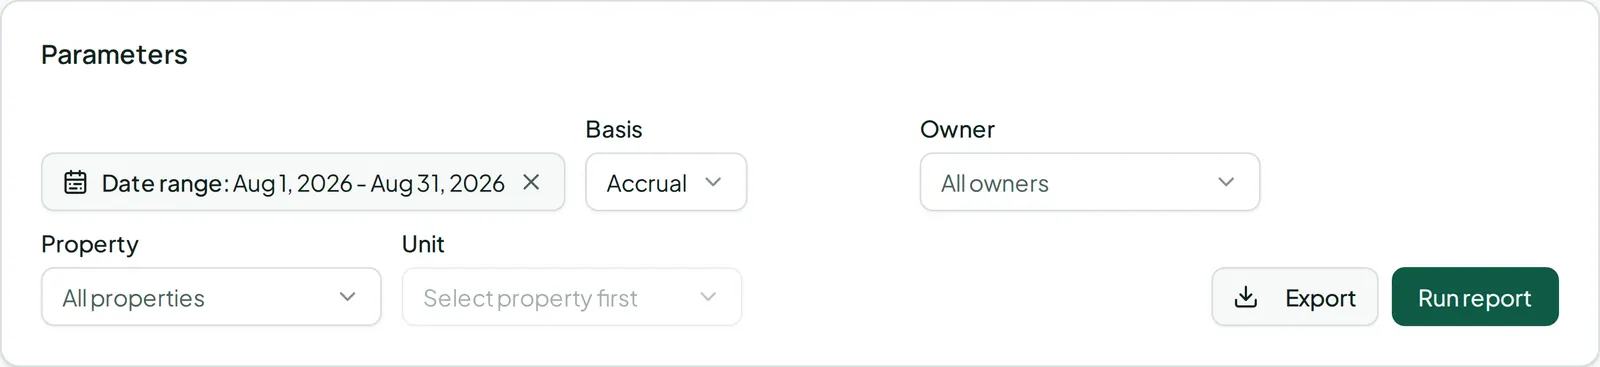
Rent Roll, Delinquency, Balance Sheet, and Security Deposit Ledger use an “as of” date — a snapshot at a single point in time. The others use a date range. Profit & Loss, Balance Sheet, and General Ledger also let you toggle between Accrual and Cash basis.
2. Read the results
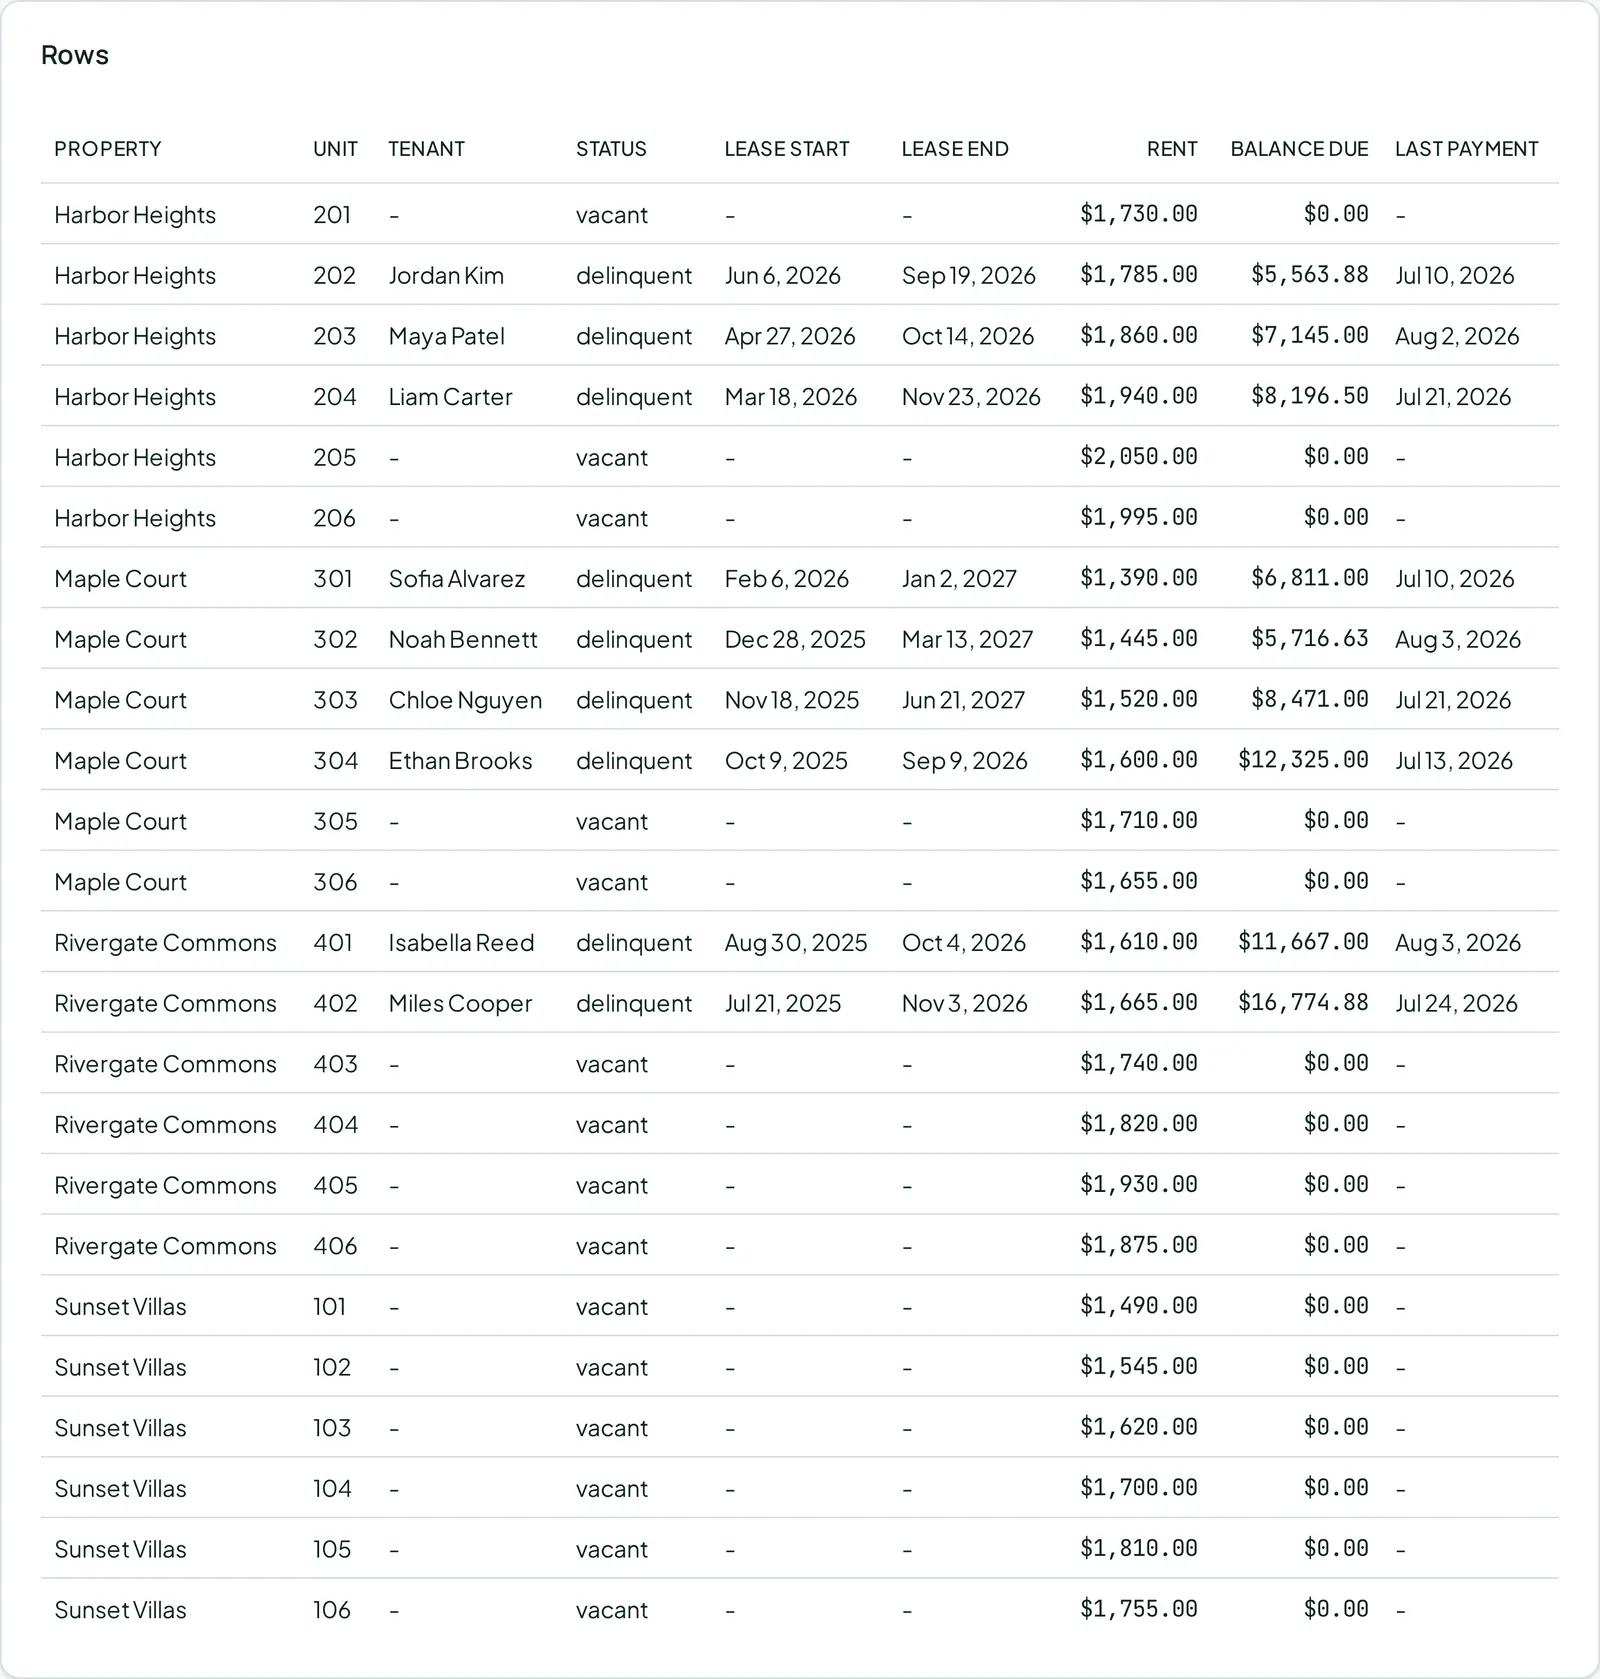
Section titled “2. Read the results”Profit & Loss, Balance Sheet, and Cash Flow render as a standard financial statement — sections with subtotals (Gross Profit, Net Income, Total Assets, and so on). Balance Sheet rows are clickable and drill straight into the General Ledger filtered to that account. Lease Expirations groups everything into buckets (0–30, 31–60, 61–90 days, etc.). Everything else is a sortable table with summary numbers up top.
3. Export it
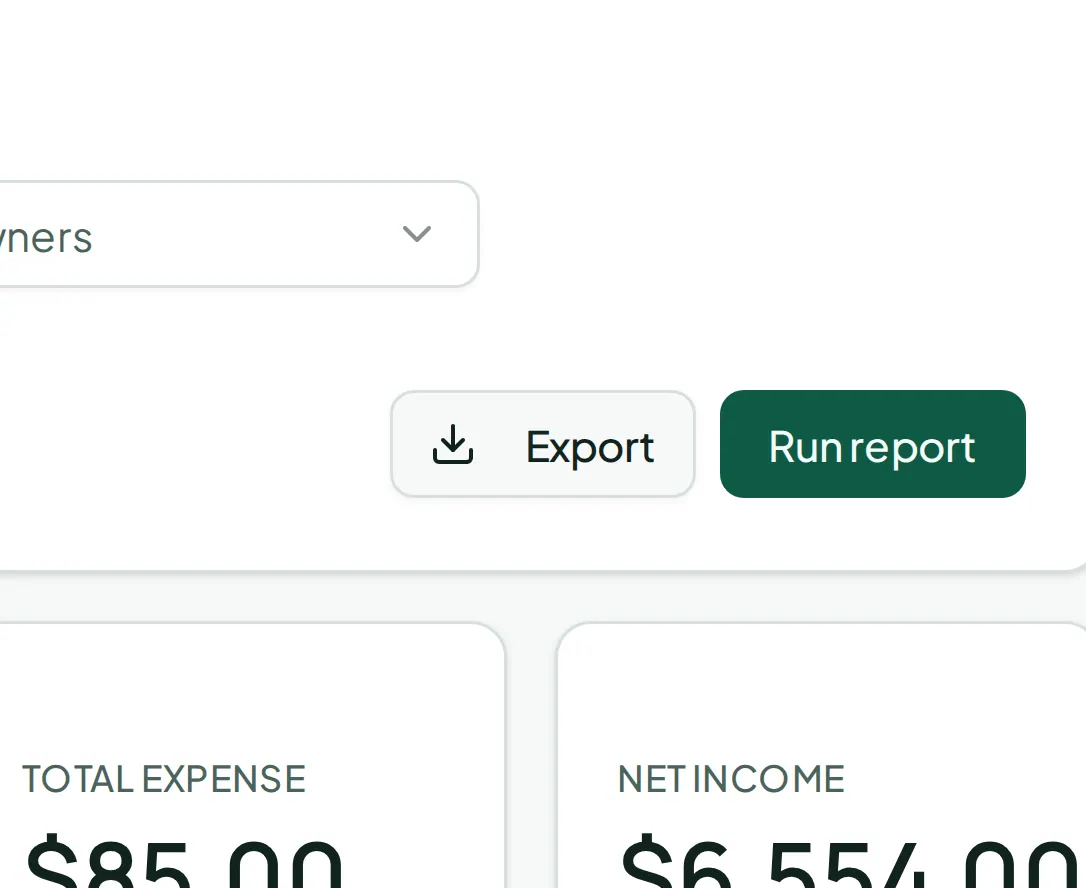
Section titled “3. Export it”Every report has an Export option for CSV, Excel, or PDF, downloaded with whatever filters you currently have applied.
A quicker view for a single property
Section titled “A quicker view for a single property”Open any property and click its Financial tab for a lighter-weight snapshot — this month’s and year-to-date income and expenses by category, without leaving the property’s page. Clicking a category there jumps straight into Accounting > Transactions, pre-filtered to that property and category.
Afterwards
Section titled “Afterwards”- Reading your portfolio analytics — trend charts, as opposed to these point-in-time reports.
- Chart of accounts and transaction history — for digging into the individual entries behind these numbers.