Reading your portfolio analytics
Go to Analytics in the top navigation for trend charts — how something has changed over time, rather than a snapshot as of one date.
Picking a metric
Section titled “Picking a metric”The left sidebar lists 14 metrics grouped into four categories:
- Financial — rent owed vs. collected, net operating income, operating expense ratio, expenses by category, outstanding receivables
- Occupancy — occupancy rate, economic occupancy, days vacant
- Leasing — new leases and move-ins, lease renewal rate, lease expirations
- Maintenance — delinquency rate, move-outs and turnover, work order throughput and resolution time
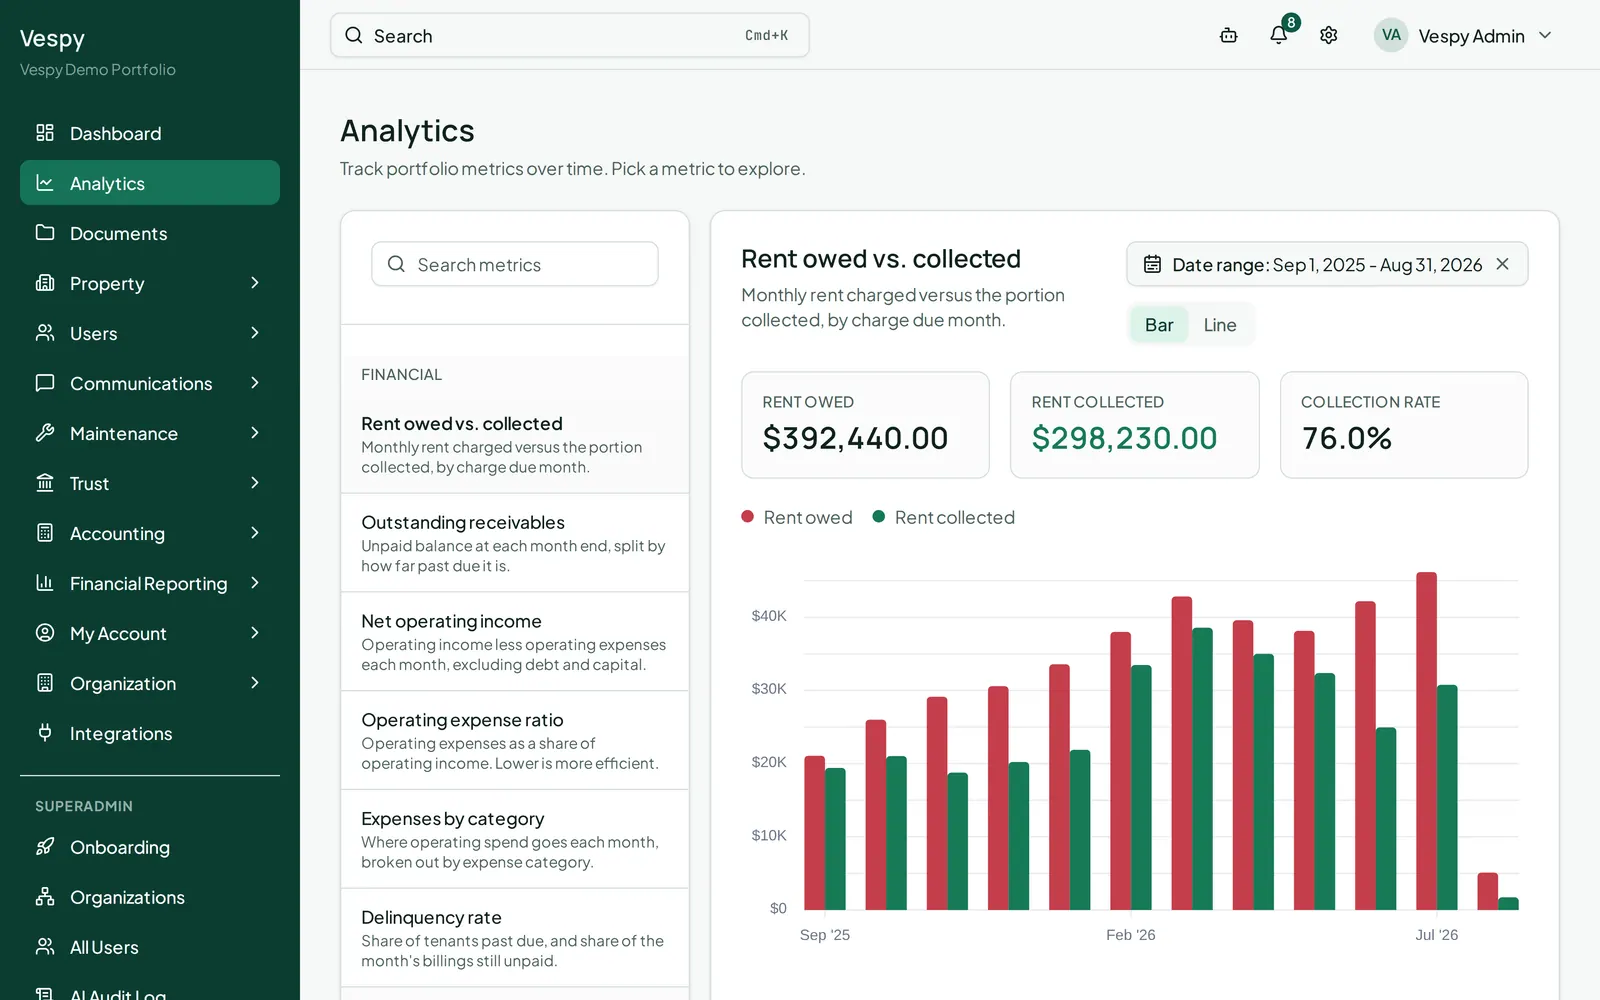
Selecting one updates the page URL, so you can bookmark or share a link straight to a specific metric.
Reading the chart
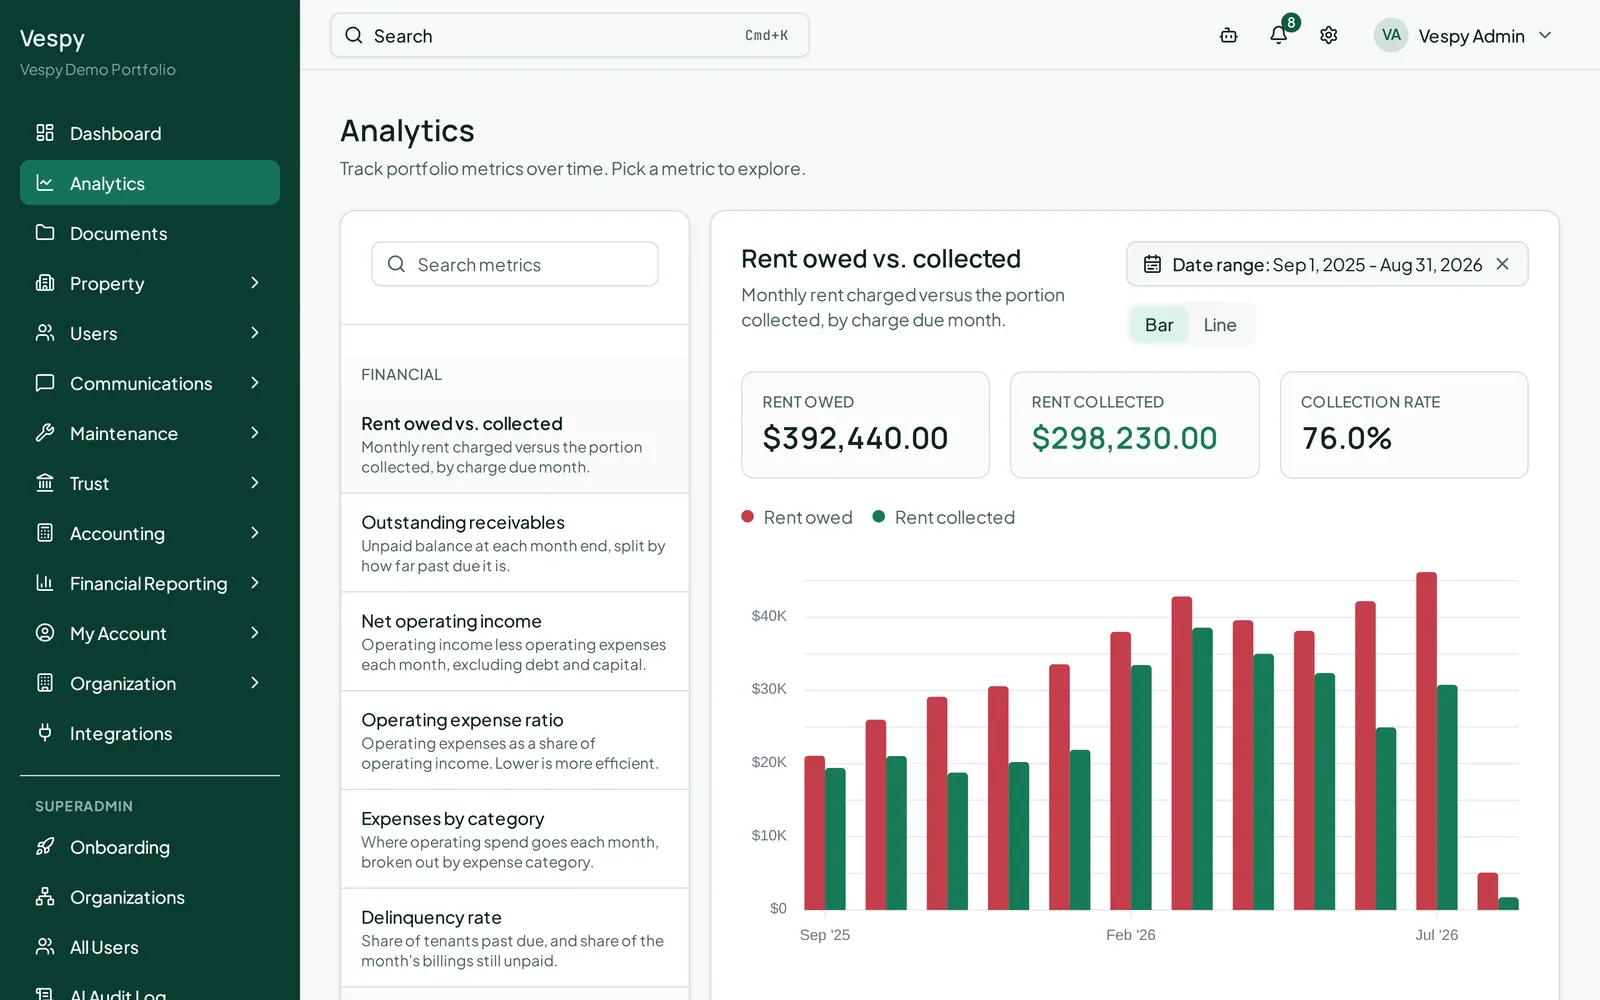
Section titled “Reading the chart”Each metric shows a date range picker (most default to the trailing 12 months; lease expirations defaults forward 12 months instead), a Bar/Line toggle, three summary KPI tiles, and a color-coded chart with a legend.
Afterwards
Section titled “Afterwards”- Running and exporting financial reports — for point-in-time numbers and exportable statements.